Rails Flash Charting Plugin
Flash charts just look a lot better than what we could do with plan images. Flash is a lot more interactive and since they are vector base you can zoom in and out without image deterioration. The PHP folks have a lot of great libraries for working with Flash such as Ming, PHP/SWF Charts, and Amfphp. If you want flashy graphs, pun intended, you can do so thanks to ZiYa, an XML/SWF Charts based Ruby on Rails plugin. ZiYa can be installed from the following SVN repository.
svn://rubyforge.org/var/svn/liquidrail/plugins/ziya/trunk
You typically install a Rails plugin by executing ‘script/plugin install URL’ from the application directory where you replace URL with the one above.
Once ZiYa has been installed you need to include one line into the controller to load the required graphing capabilities. Add the following line in the controller near the top.
[source:ruby]
include Ziya
[/source]
To follow along with the code examples, create a bargraph action in the controller so that we can create a bar graph. In the bargraph action we will create a bar chart object with code similar to the following.
[source:ruby]
def bargraph
chart = Ziya::Charts::Bar.new
render :text => chart
end
[/source]
The new bar chart will contain default data so that at this point we can quickly move onto the view and see ZiYa and XML/SWF in action. You do not have to create a rhtml view for bargraph since the action will generate the necessary XML required for the chart. You can render the chart in any rhtml view by adding the following view helper code.
[source:ruby]
<%= gen_chart(“chart_id”,
url_for(:controller => ‘mycontroller’, :action => “bargraph”),
“#ffffff”,
400,
300) %>
[/source]
The above action and view code will generate a chart with default data that looks like the following.
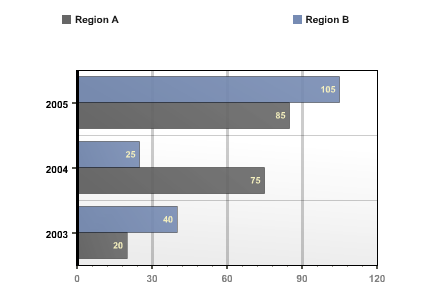
if you want to create a similar graph with code replace the action with the following code.
[source:ruby]
def bargraph
chart = Ziya::Charts::Bar.new
chart.add(:axis_category_text, [ “2003”, “2004”, “2005”])
chart.add(:series, “Region A”, [100, 25, 40], [‘Large’, ‘Low’, ‘Soso’])
chart.add(:series, “Region A”, [80, 70, 20])
render :text => chart
end
[/source]
For this graph, the :axis_category_text symbol indicate that the following values are the y-axis labels. To produce x-axis labels you can add data for :axis_value_text. The series symbol indicates your data points. You will also notice that when setting the series data point there is an optional string array. That string array is used as legend or label for the bars in this series. The chart is highly customizable, you can create yml files that describe the theme such as color, border, and even animation effect for each charts.
The other graph types are just as easy to generate. Just as an example below is the action code required to generate a pie chart.
[source:ruby]
def piegraph
chart = Ziya::Charts::Pie.new
chart.add :axis_category_text, [“2003”, “2004”, “2005”]
chart.add :series, “Region I”, [200, 100, 50], [‘Super’, ‘Large’, ‘Medium’]
render :text => chart
end
[/source]
ZiYa is such a large and rich plugin that I obviously can’t do it justice. Please take a look at the Google Groups and official documentation.
Technorati Tags: ruby, rails, rubyonrails, chart, graph, ming, php, plugin, rails plugin, xml/swf, php/swf, flash, ziya, swf